
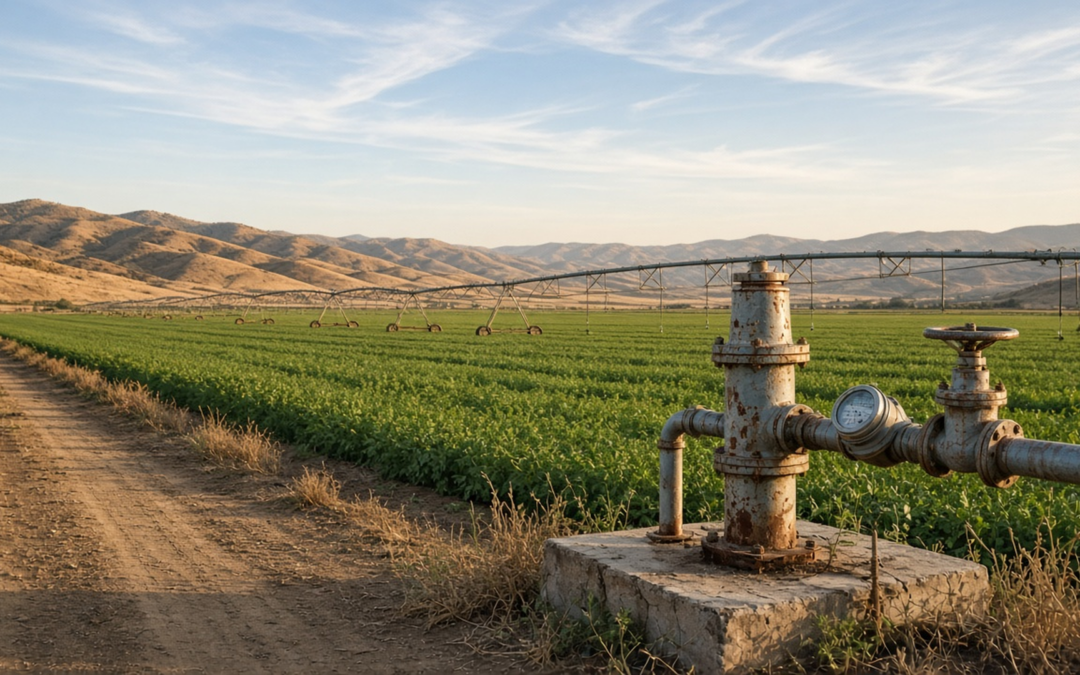
Nobody notices a well losing ground. The pump still runs, the pivot still turns, and the water still comes. But each season it takes a few more feet of drawdown to get the same gallons, and the power bill carries the difference. By the time the pump starts surging in August, the slow part of the problem has been going on for years.
There is one number that catches it early: specific capacity. It takes two measurements and one line of math, and if you record it at the same time every year, it tells you whether your well is holding steady or slowly plugging, and when it is time to call your well driller before the season makes the call for you.
This is Part 2 of our well series. Part 1, Drawdown vs. Pump Level: How Low Can Your Well Go?, covers the room between your pumping level and the pump intake. This one is about the long-term trend.
Quick Takeaways
- Specific capacity = flow rate ÷ drawdown, in gallons per minute per foot (gpm/ft). Higher is better.
- NDSU Extension recommends measuring and recording it at the same time each year, ideally in August, when water levels are at their lowest.
- NDSU’s trigger: when specific capacity falls to around 80 percent of new, rehabilitate the well. Other groundwater guidance uses a 25 percent drop. Pick a trigger with your driller and stick to it.
- A falling number can mean a plugging screen, a tired pump, or a lower water table. The number tells you when to look; your driller and pump contractor tell you why.
What specific capacity actually measures
Every pumping well draws down. Drawdown is the difference between the static water level (pump off) and the pumping water level (pump on). NDSU Extension describes it as the head needed to push water through the aquifer and into the well at the flow rate you want.
Specific capacity divides the flow you are getting by the drawdown it costs you:
Specific capacity (gpm/ft) = flow rate (gpm) ÷ (pumping level − static level)
A well that delivers 900 gpm with 50 feet of drawdown has a specific capacity of 18 gpm/ft. If, a few years later, it takes 59 feet of drawdown to deliver 850 gpm, specific capacity has dropped to about 14.4 gpm/ft. Same well, same pump, less water per foot of lift.
That is why it beats watching water levels alone. Level by itself moves with the season, your set length, and your neighbors. Specific capacity ties level to flow, so it shows you how hard the well is working for what it gives you.
The yearly record: NDSU’s example
NDSU Extension’s irrigation well guide includes a sample yearly record that shows exactly what decline looks like:
| Year | Flow (gpm) | Pumping level (ft) | Static level (ft) | Drawdown (ft) | Specific capacity (gpm/ft) | Compared to new |
|---|---|---|---|---|---|---|
| 1 | 900 | 80 | 30 | 50 | 18.0 | 100% |
| 2 | 900 | 73 | 22 | 51 | 17.6 | 98% |
| 4 | 880 | 85 | 31 | 54 | 16.2 | 90% |
| 6 | 850 | 89 | 30 | 59 | 14.4 | 80% |
Look at Year 6. The static level is about where it was in Year 1, so the aquifer is not the obvious culprit. Yet the well needs 9 more feet of drawdown to deliver 50 fewer gallons per minute. On NDSU’s scale, that 80 percent mark is the point to rehabilitate.
How to take the measurement
You need three numbers, measured the same way every time.
- Static water level. Measure with the pump off and the water level recovered. Note how long the pump has been off, and use the same recovery time each year.
- Pumping water level. Measure after the pump has run at its normal rate long enough for the level to settle. The Water Replenishment District of Southern California notes that driller’s tests typically run at least 24 hours at a constant rate, and that later tests should use the same time frame so the comparison is fair.
- Flow rate. Read it from an accurate flow meter on that well. NDSU calls a flow meter on each well and a usable access port in the casing (at least 1 inch, 2 inches preferred) important for exactly this reason.
Get your baseline. The best starting point is the specific capacity from the pumping test when the well was drilled and developed. It is usually on the driller’s log. WRD calls that first value the benchmark for every future test, because a well is rarely better than the day it was finished. If you cannot find the log, your first careful August test becomes your baseline.
Keep the timing consistent. NDSU recommends the same time each year and points to August, when pumps have been running for a while and both static and pumping levels are at their lowest. WRD suggests testing at least twice a year and collecting static and pumping levels monthly for earlier warning. Whatever cadence you choose, compare August to August, not August to April.
Why the number falls
A drop in specific capacity is a symptom, not a diagnosis. The common causes:
- Screen and gravel-pack plugging. NDSU groups screen problems into physical (sand and silt), biological (iron bacteria), and chemical (mineral incrustation) blockage. Each one raises drawdown and pumping energy. NDSU also warns that letting the pumping level drop below the top of the screen exposes it to air, which speeds up mineral buildup.
- A pump losing performance. WRD lists pump wear as one reason specific capacity declines. Less flow from the pump changes the math even if the screen is clean.
- Lower static water levels. A drought year or heavy area pumping can lower the water table. Our post on aquifer drawdown vs. a pump or well problem walks through how to tell the difference.
This is where a yearly record pays off. A single bad reading could be anything. A steady slide over three or four Augusts, with the static level holding, points your driller straight at the screen.
What the decline costs
More drawdown means more lift, and more lift means more power. NDSU’s guide gives an example: an extra 10 feet of drawdown on a well producing 800 gpm adds about $140 per growing season in pumping energy, based on 900 hours of pumping at an off-peak rate of 7 cents per kilowatt-hour. Your rate, hours, and pump efficiency will change the number, but not the direction. Every foot of lost capacity is paid for in the electric bill and in gallons that never reach the field.
When to call for rehab
NDSU says that when specific capacity falls to around 80 percent of new, or the pump starts sucking air, flow blockage is usually significant and it is time to rehabilitate. WRD cites a 25 percent drop as the point to start rehabilitation work, and warns that if specific capacity is allowed to fall too far, the loss may not be reversible.
A few practical points:
- Do not wait for the surge. A pump sucking air mid-season leaves you with NDSU’s three in-season options: throttle the discharge valve (a temporary fix that cuts flow to the system), rehabilitate, or drill a replacement well. Rehab scheduled in the off-season is the better version of the same decision.
- Rehab is a licensed professional’s job. NDSU recommends a licensed well driller. Typical work combines mechanical cleaning of the casing and screen with chemical treatment matched to what is plugging it.
- Retest after rehab. A new post-rehab specific capacity tells you how much you recovered and resets the baseline you track against.
Questions growers ask
What is a good specific capacity for an irrigation well?
There is no universal good number. It depends on the aquifer and how the well was built. What matters is how your well compares to its own baseline from when it was new.
How do I calculate specific capacity?
Divide the pumping rate in gallons per minute by the drawdown in feet (pumping level minus static level). For example, 900 gpm with 50 feet of drawdown is 18 gpm/ft.
How often should I check specific capacity?
NDSU Extension recommends at least once a year at the same time, ideally August. WRD suggests testing twice a year and checking static and pumping levels monthly.
When should I rehabilitate my irrigation well?
NDSU recommends rehab when specific capacity drops to around 80 percent of new or the pump starts sucking air. Some groundwater agencies use a 25 percent drop. Decide on a trigger with your well driller.
Does a lower water table lower specific capacity?
It can. That is why you should note the static level with every test. A falling specific capacity with a steady static level points toward the screen or the pump. A falling static level points toward the aquifer.
How AgriLynk Helps
The hardest part of a specific capacity record is not the math. It is getting a clean static level, pumping level, and flow reading from a well that might be miles away, at the same point in the season, every year. AgriLynk remote well monitoring brings well water level into one dashboard, and flow, pressure, and well depth sensors can be added as expansion modules, so the readings you need for the yearly check are already in your history instead of on a clipboard. Alerts at thresholds you set tell you when drawdown starts creeping up mid-season, not just once a year.
For a single remote well, a solar-powered cellular field station connects directly to the cloud with no farm gateway or field Wi-Fi. Where wells, pumps, and valves are clustered, a shared-gateway network puts them on one dashboard, and pump and well control can follow. Well setups are quoted to your site; see pricing for published starters, or call (760) 723-1529. AgriLynk does not replace your well driller or pump contractor. It helps you bring them a trend instead of a guess.
Setting the alert first? Start with Drawdown vs. Pump Level, or tell us about your well.
Sources
- NDSU Extension AE97: Care and Maintenance of Irrigation Wells (PDF, reviewed and reprinted February 2022)
- Water Replenishment District of Southern California, Technical Bulletin Vol. 2: Specific Capacity, Part 1 of 2 (PDF, 2005)
- Water Replenishment District of Southern California, Technical Bulletin Vol. 3: Specific Capacity, Part 2 of 2 (PDF, 2005)